Gantt chart
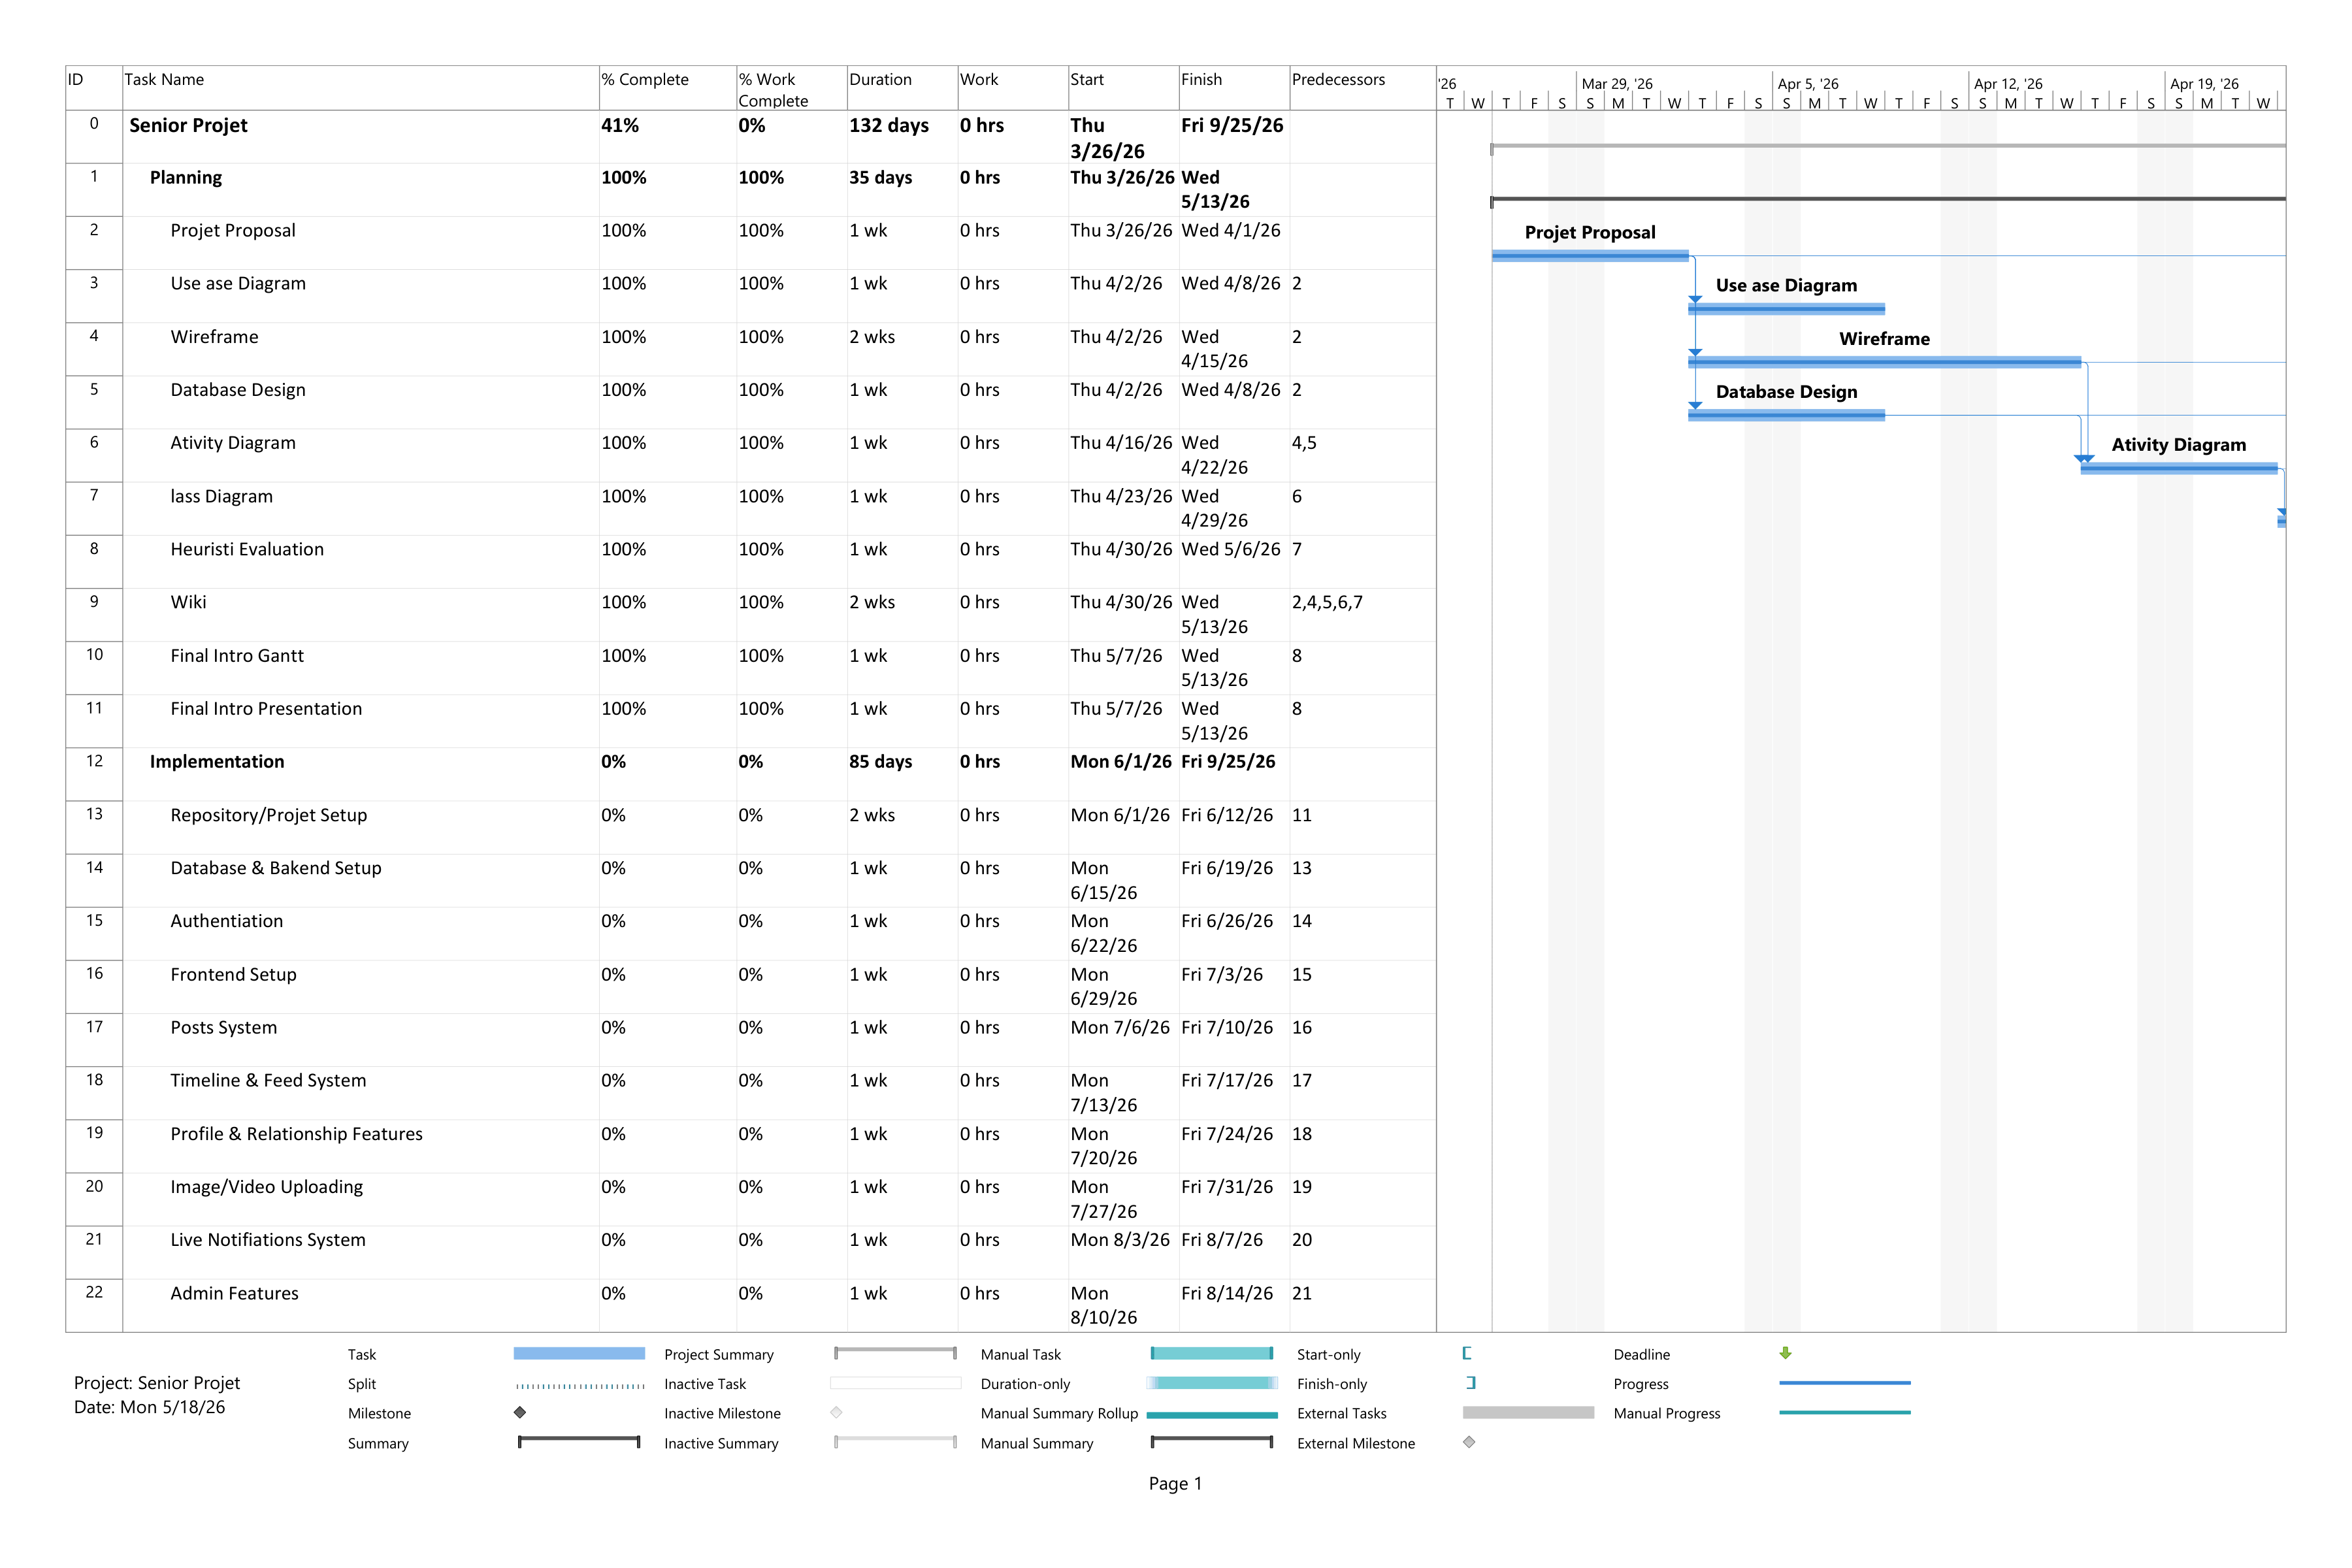
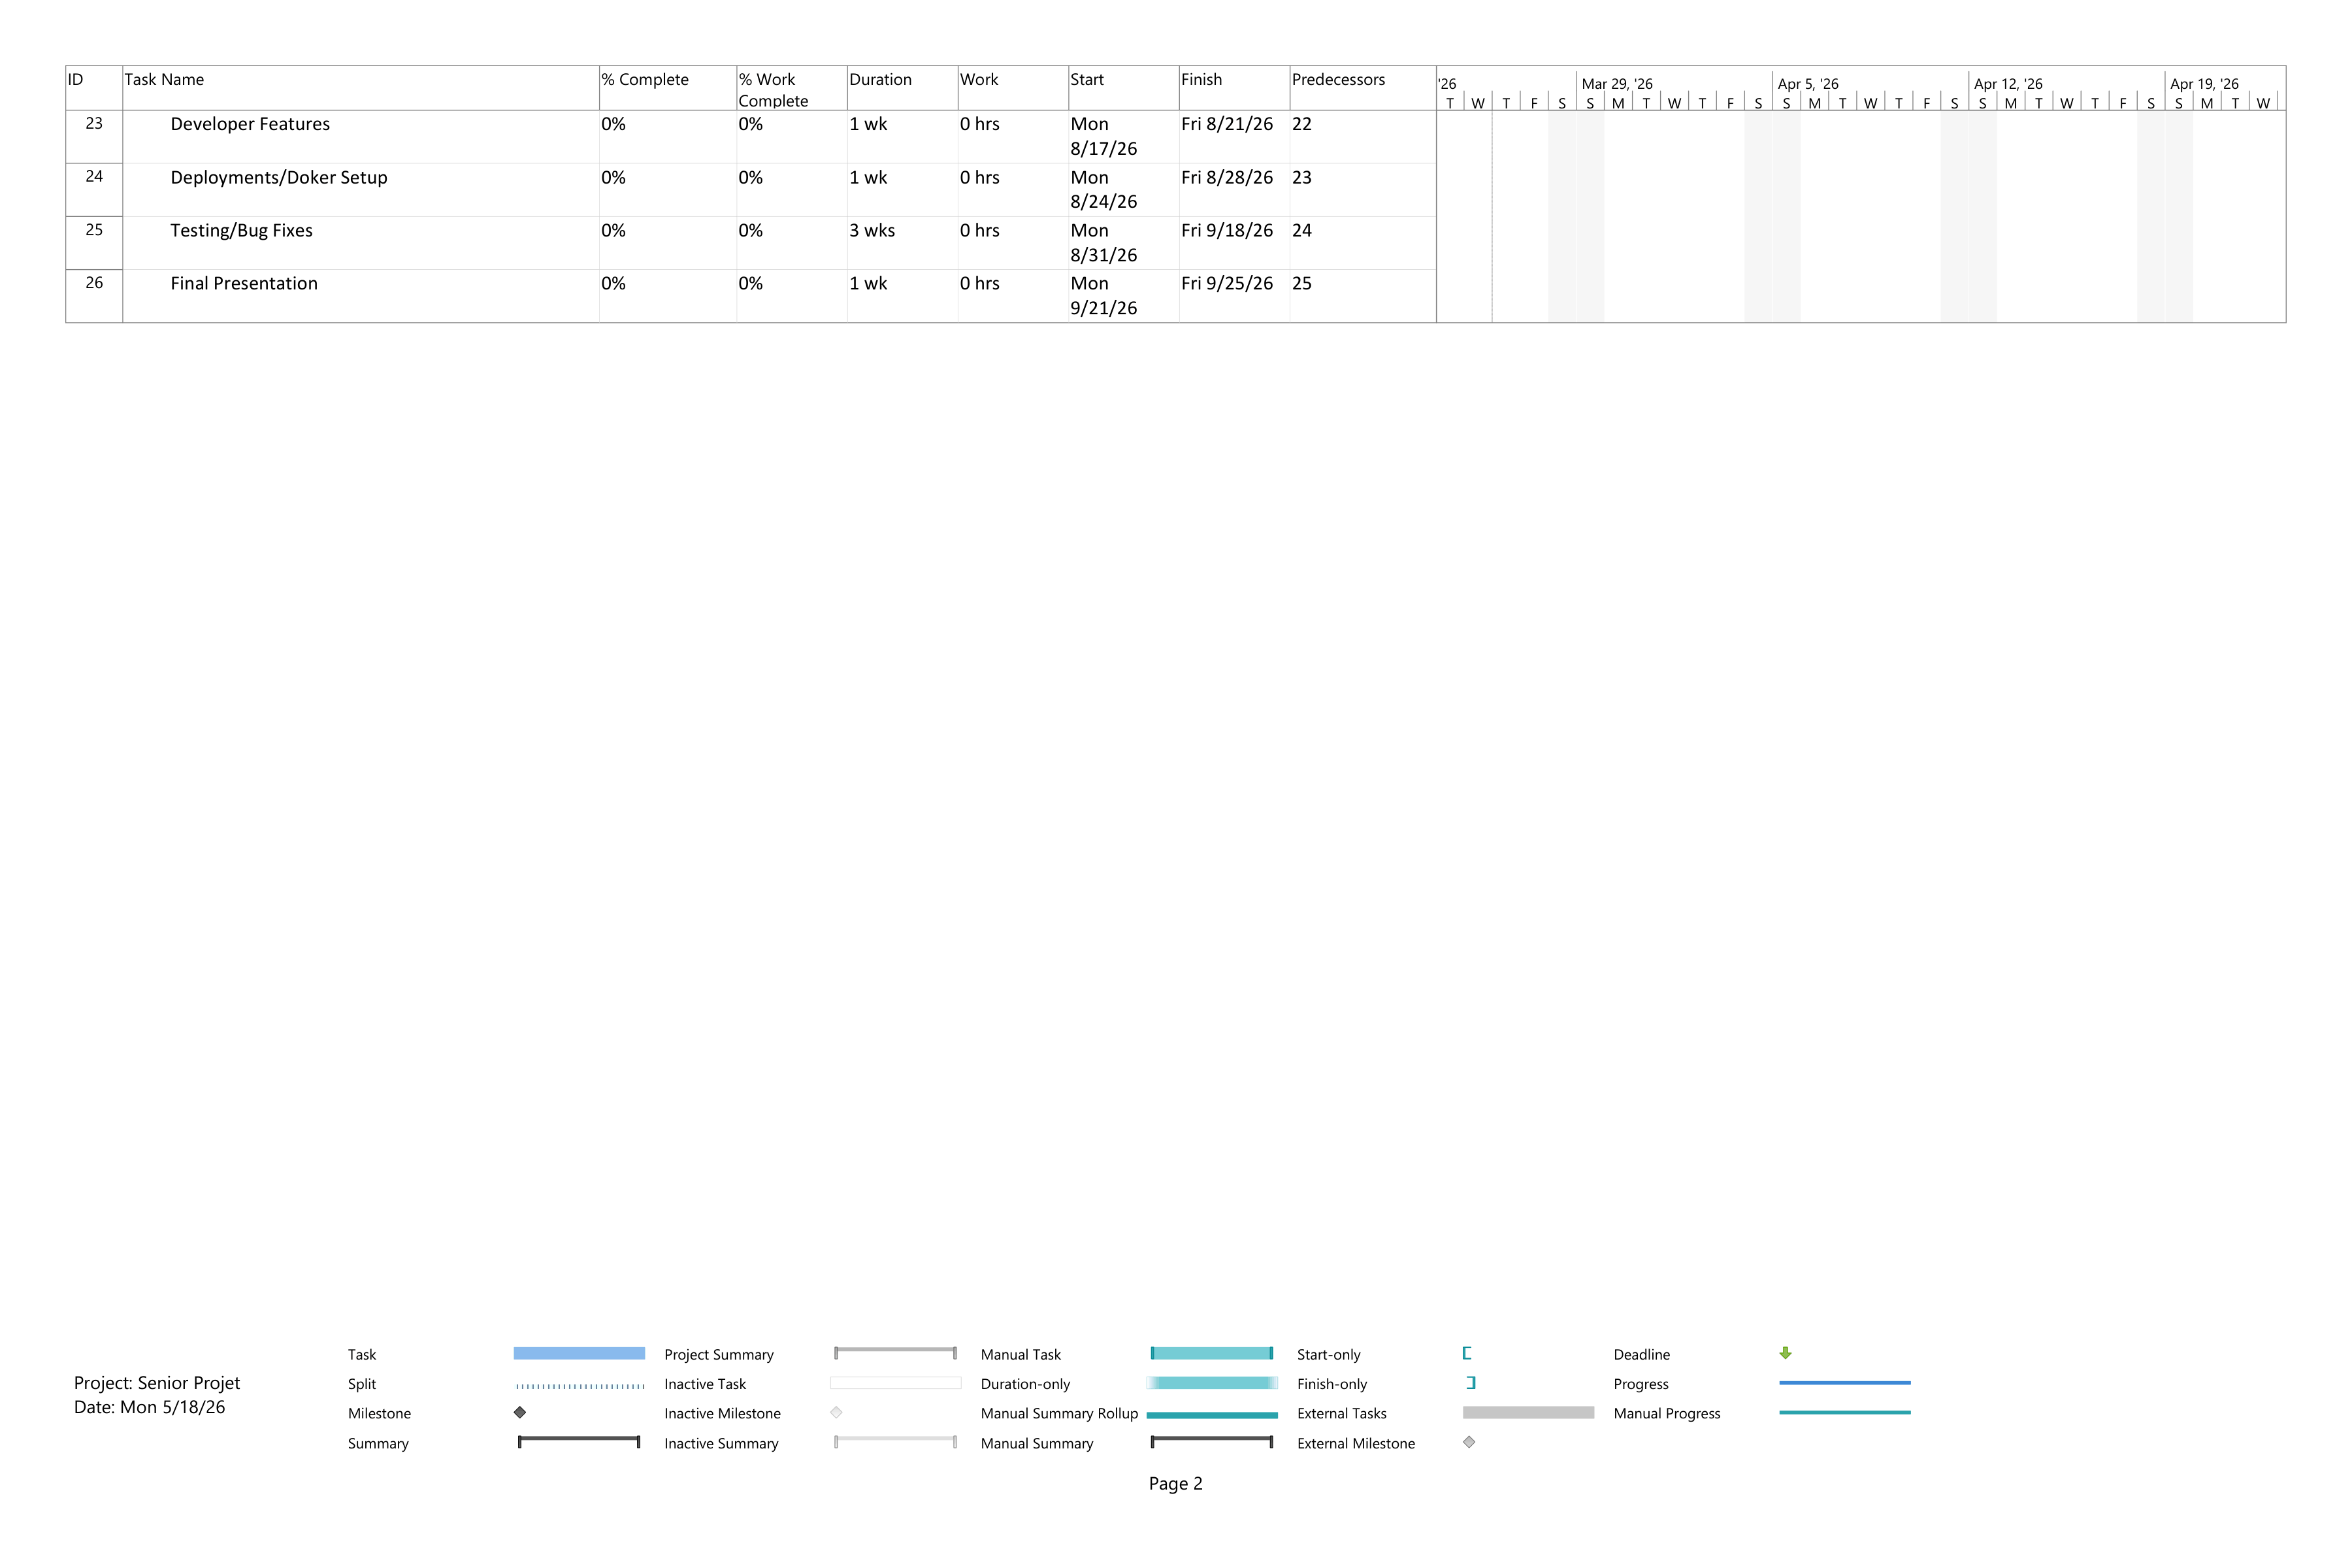
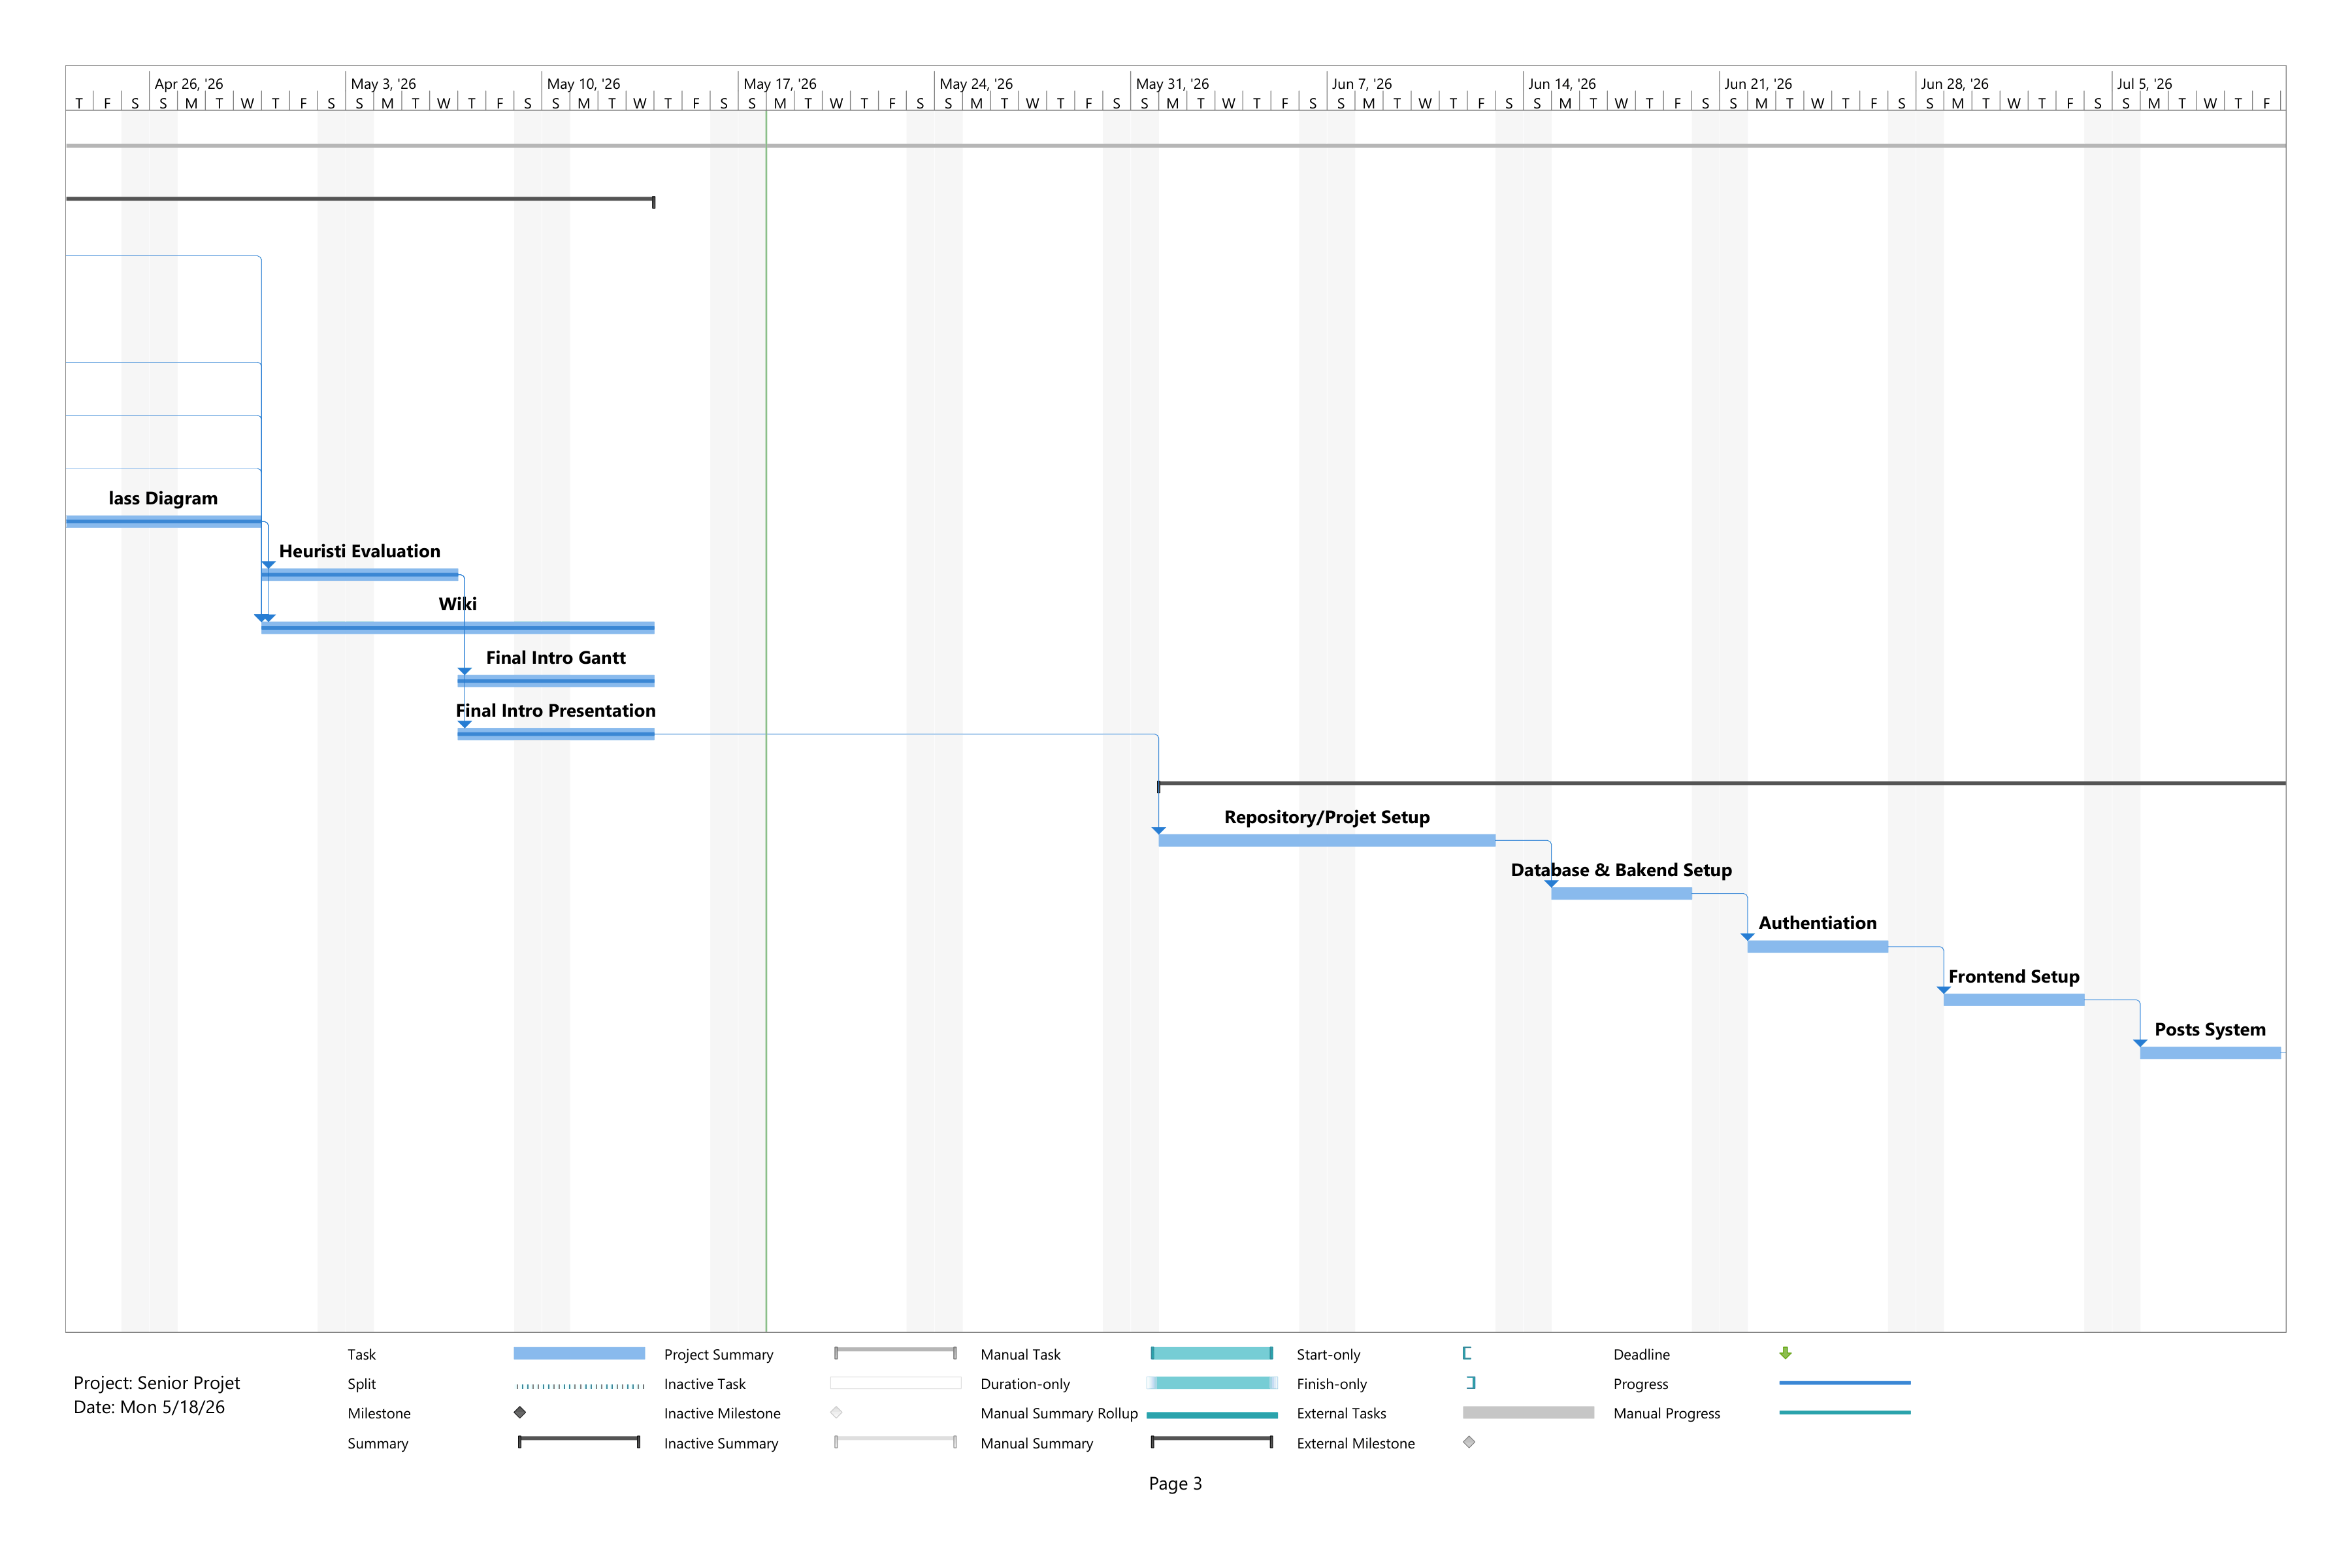
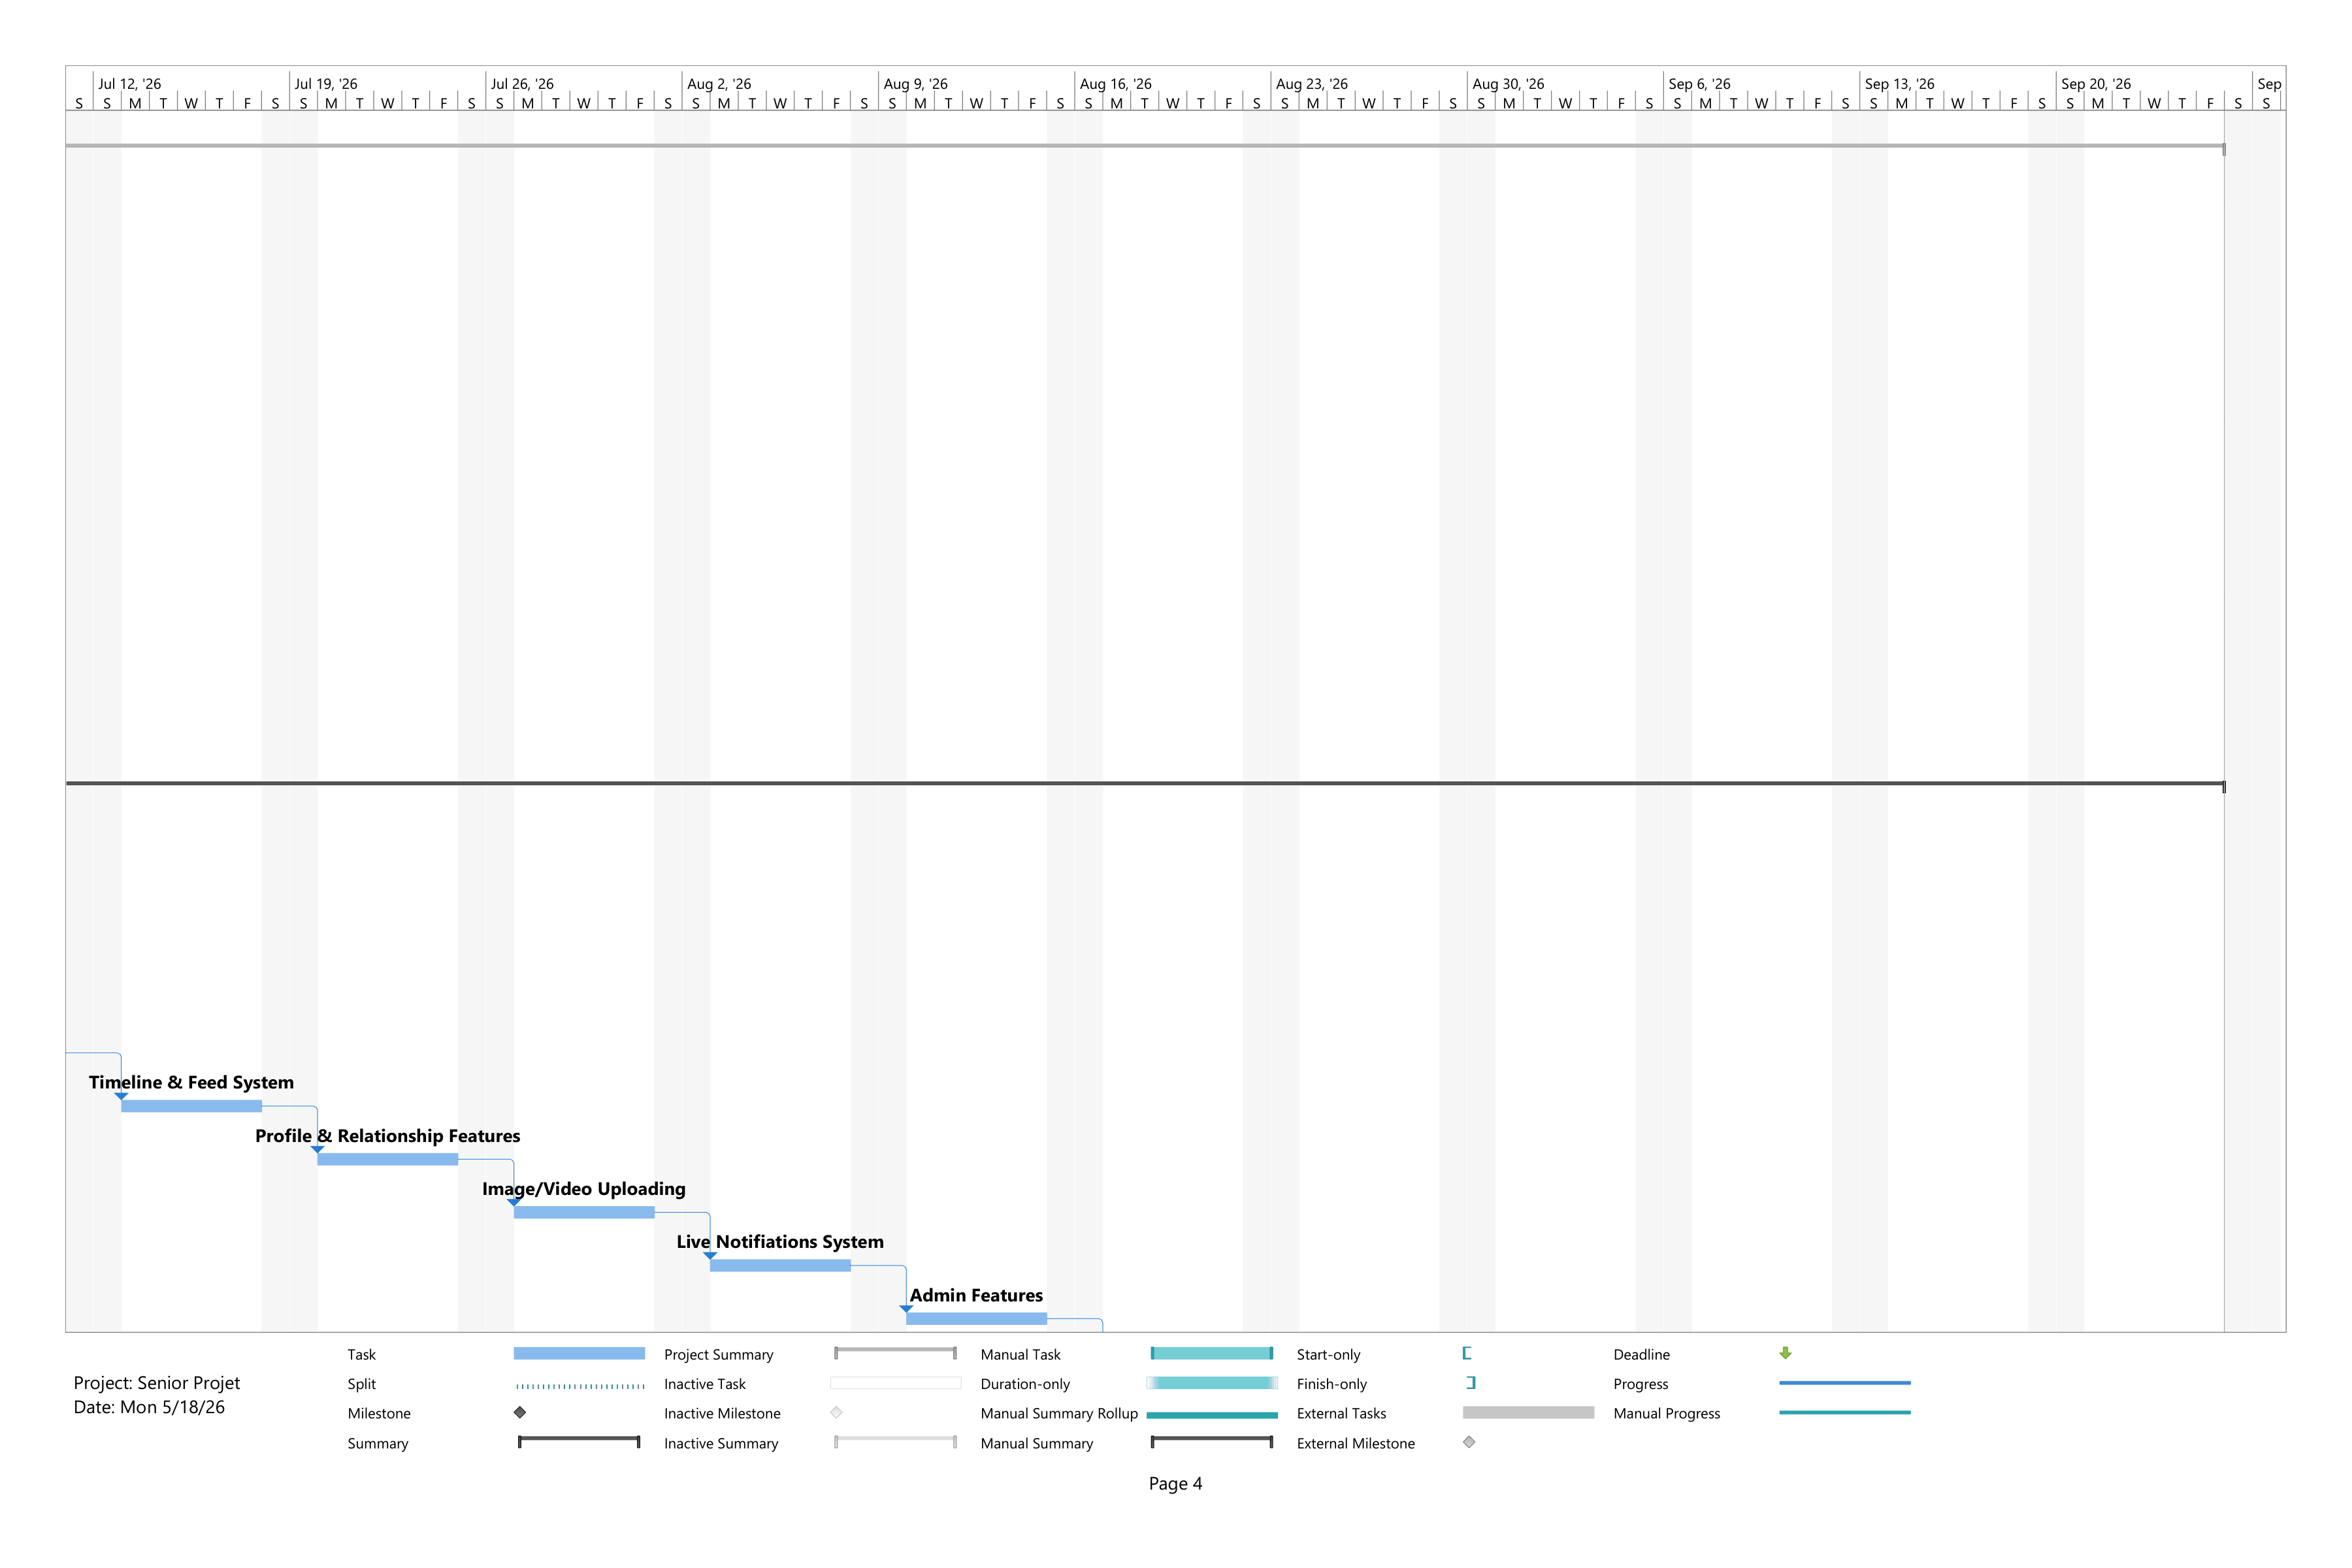
This is the 20-week Gantt from the end of Intro to Senior Project (dated May 18, 2026). It covers both quarters: planning (March to May) and implementation (June to September). We did not make a second chart just for the coding quarter.
Planning tasks are marked complete. Implementation was still at 0% when we exported it, because that half was the plan for this quarter. Those tasks are done now, except the final presentation.
The midterm version from planning week 5 only covered the first quarter. That one is under Planning week 05.
Full project (both quarters)
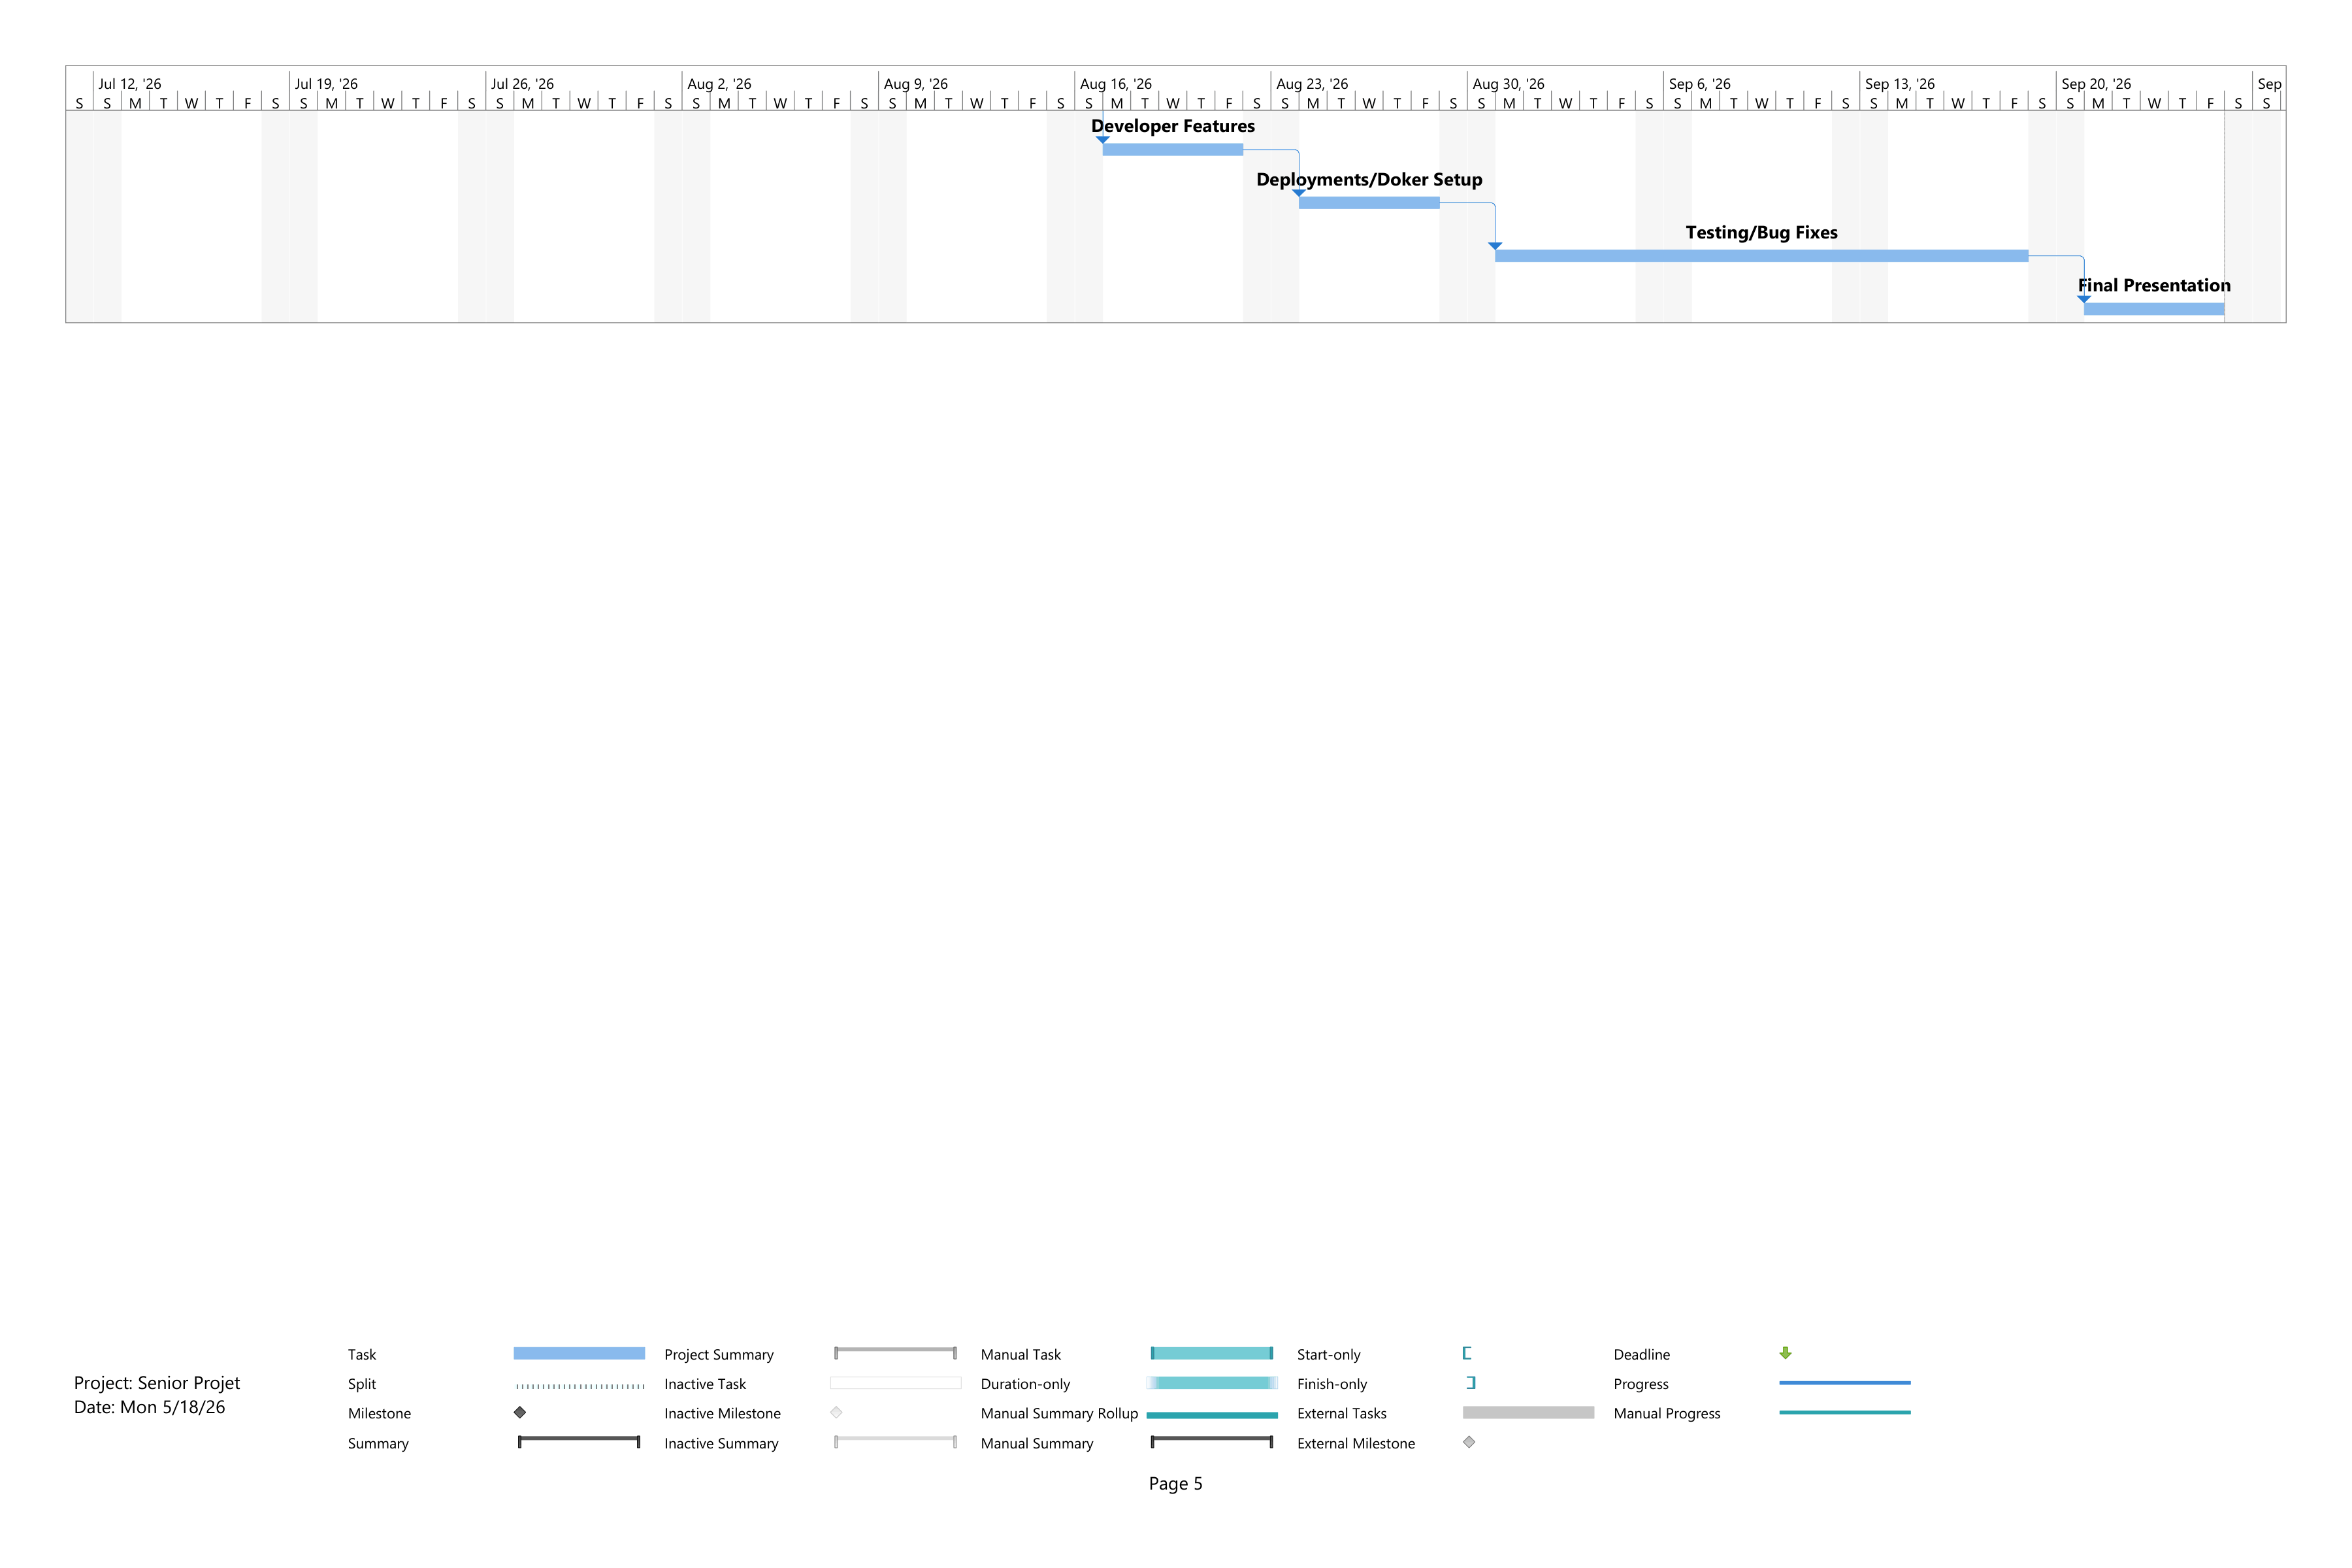
What the implementation bars were
| Planned task | Planned window |
|---|---|
| Repository / project setup | Jun 1 to 12 |
| Database and backend setup | Jun 15 to 19 |
| Authentication | Jun 22 to 26 |
| Frontend setup | Jun 29 to Jul 3 |
| Post system | Jul 6 to 10 |
| Timeline and feed | Jul 13 to 17 |
| Profile and relationship features | Jul 20 to 24 |
| Image / video uploading | Jul 27 to 31 |
| Live notifications | Aug 3 to 7 |
| Admin features | Aug 10 to 14 |
| Developer features | Aug 17 to 21 |
| Deployment / Docker | Aug 24 to 28 |
| Testing / bug fixes | Aug 31 to Sep 18 |
| Final presentation | Sep 21 to 25 |
Frontend and API work actually ran in parallel from implementation week 2, not in that strict order. The site went live at emotial.app in implementation week 9.